6.5 Evaluating societal outcomes: Fairness and efficiency
In Section 5.7, we introduced two criteria for evaluating outcomes: fairness and efficiency.
- inefficient
- No definition available.
- efficiency
- A standard for evaluating an outcome that asks whether all the mutual gains from an interaction have been realized: whether anything of value has been left on the table.
In economic interactions like those we’ve evaluated in this chapter, an allocation is inefficient when there are alternative outcomes in which at least one person is better off, and no one else is harmed. An outcome is efficient when there are no other outcomes that can make someone better off without harming anyone else.
Finding inefficient and efficient outcomes in games
Let us return to the interaction between Ana and Ben about whether to use integrated pest control (IPC) or a toxic pesticide, as shown in Figure 6.5. We abbreviate each strategy as follows: I = Integrated Pest Control and T = Toxic Tide.
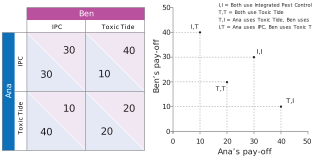
Figure 6.7 The four allocations in the pest control game. The payoffs in the game table at each outcome in the left-hand panel correspond to the payoffs that each player receives in the figure in the right-hand panel, with each allocation labeled for the actions that each player plays at that allocation.
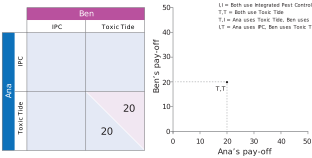
The (T,T) allocation
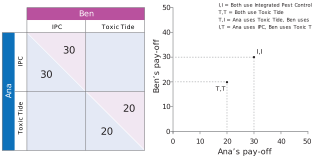
The (T,T) and (I,I) allocations
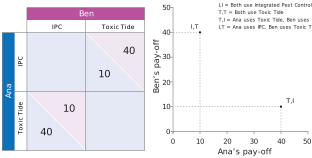
The (T,I) and (I,T) allocations
All four allocations in the game
We now also use a tool similar to the one from Chapter 4 (Section 4.3) to show the cost of a given technology using two inputs. The tool in Chapter 4 showed the number of workers (horizontal axis) and the amount of coal (vertical axis) for a set of technologies producing a particular output. Our new figure also includes insights from the ultimatum game in Chapter 5, where we examined the shares of income each participant received, allowing us to consider each person’s payoff.
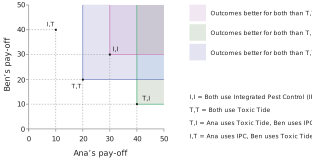
In Figure 6.8, we show the payoffs in the game table and how they correspond to coordinates with Ana’s payoffs on the horizontal axis and Ben’s payoffs on the vertical axis. Ana prefers any allocation farther to the right. Ben prefers any allocation that is further up. Allocations that are upward and to the right are therefore better for both, which allows us to compare points and determine which are efficient and which are inefficient.
Author query: the Figure Sheet, alt-text sheet, and supplied PPT file only go up to Figure 6.8e, but the linked figure step-by-step document goes up to Figure 6.8i. Please confirm if the captions are correct if there are only five slides, or supply the missing slides f-i.
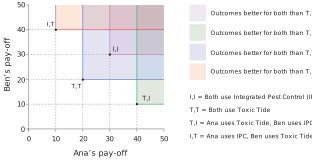
Figure 6.8 Allocations in the pest control game and outcomes with greater gains from cooperation than each allocation—the win-win outcomes. The shaded areas indicate allocations that have greater gains from cooperation than the labeled allocations.
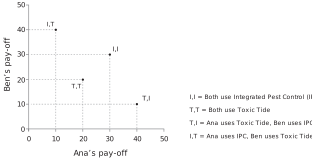
Allocations in the pest control game
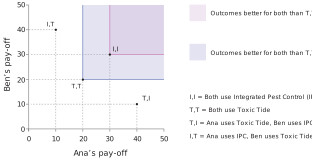
The allocations that both players prefer to (T,T)
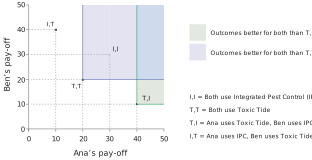
The allocations that both players prefer to (I,I)
The allocations that both players prefer to (T,I)
The allocations that both players prefer to (I,T)
- gains to cooperation
- In a strategic interaction, payoffs in excess of outside options are called the gains to cooperation. Gains to cooperation are also sometimes called rents.
- gains from exchange
- The benefits that each party gains from a transaction compared to how they would have fared without the transaction.
- inefficient
- No definition available.
Figure 6.8 shows the potential gains from cooperation or gains from exchange that we need to consider in the pest control game between Ana and Ben. The steps in the figure show which outcomes are efficient and why. An outcome is inefficient if there are alternative outcomes where at least one person is better off and no one is harmed: the shaded areas show, for each allocation in the game, where alternative outcomes with greater gains from cooperation may lie. The first step in Figure 6.8 shows that when we compare allocation (T,T) and (I,I), each player receives a payoff of 20 at (T,T), and therefore, there is a win-win outcome at allocation (I,I), where each player receives a payoff of 30. Allocation (T,T) is therefore inefficient. Allocation (I,I) is efficient because there are no other allocations where either player can be better off without harming another player. That is, no other allocations lie above and to the right of (I,I).
Comparing allocations (T,T) and (I,I) allows us to compare an inefficient outcome (T,T) with an efficient outcome (I,I). But there are two other efficient outcomes in the pest control game: (T,I) and (I,T). They are efficient because there are no other outcomes where the players can do better without harming another player. All we need for an outcome to be efficient is that there are no other outcomes where the players can find an alternative win-win outcome. Thinking graphically, if an allocation is efficient, then there are no other allocations that have the same or greater horizontal-axis coordinate and the same or greater vertical-axis coordinate.
What about fairness?
When we evaluated the four outcomes for efficiency, all that mattered was whether one outcome had greater gains from cooperation than another—for example, comparing (I,I) with (T,T), where (T,T) was a win-win outcome and (I,I) was not. But what about fairness?
Referring to Figure 5.7, our considerations of fairness depend on the answers to two questions:
- Is there an allocation that would be fairer?
- Are the rules that produced the allocation fair?
To answer the second question of whether the game is procedurally fair, we might think that if the rules of the game that produced any allocation were fair, then any allocation of the game should be considered fair. But if we consider the substantive fairness of the outcomes, then we might evaluate the first question by asking whether any allocation was fairer than another by considering the distribution of the payoffs among the players.
If we compare (T,T) and (I,I), neither one immediately appears fairer than the other. Each person gets 50% of the possible pie, similar to what we saw in the ultimatum game in Chapter 5. However, at (I,T) or (T,I), one person gets a payoff of 40, and the other gets a payoff of 10. Since the total amount available is 50, the player playing Toxic Tide gets ⅘ or 80% of the total, whereas the player playing IPC gets ⅕ or 20% of the total. As we saw in the ultimatum game, players who are offered as little as 20% often reject the offer because they consider it unfair. Similarly, we might consider the unequal allocations in a game like the pest control game as unfair, and so players might avoid them.
Everyday Economics 6.7
Utah’s Great Salt Lake is a good example of a prisoners’ dilemma. The lake shrinks when too much water is diverted upstream for farms, cities, and industry. Each water user faces a tempting choice: keep using water as usual (more crops, lawns, and production today) or conserve (leave more water in rivers so it reaches the lake). If everyone conserves, the lake level stabilizes, reducing harmful dust and protecting wildlife and lake-based industries. But if one farmer (or city) conserves while others don’t, the conserver pays the cost (less output or convenience) while others still enjoy most of the benefits. Therefore, each may do the best they can by “using water now” even though the result, when everyone does the same thing, is worse for all. How would you draw a game table between two actors in Utah with these strategies? How are external effects part of this interaction? What do you think is a fair and/or efficient solution to this problem?
Moreover, players might care so much about fairness that they would rather both do worse and get a payoff of 20 than have the other person get a much higher payoff than theirs. That is, people would rather both play Toxic Tide with payoffs (20,20) corresponding to a fairer outcome than the less fair (40,10) or (10,40) outcomes. In this way, people may choose fairer and inefficient outcomes over outcomes that are efficient but less fair.
What about the equilibrium of the game?
We said earlier that both players playing Toxic Tide was the game’s best-response equilibrium. At the equilibrium, each player received a payoff of 20. Our methods indicate that the best-response equilibrium may be fair and inefficient. It is fair because both players have 50% of the pie (substantive fairness) and they agree that the rules are fair (procedural fairness). It is inefficient because the players could do better by both playing IPC and earning payoffs of 30, yielding greater gains from cooperation than at the equilibrium. Our diagnosis also shows that, even with the opportunity to achieve greater gains from cooperation, players will struggle to reach it because it is not a mutual best response.
Evaluating the outcomes of games
Let us compare the two important games in this chapter.
The corn–soy game depicted in Figure 6.2 and Figure 6.3 is an invisible hand game:
- The best-response equilibrium (Corn, Soy), which gives payoffs of 60 to both Ana and Ben, is efficient because there are no further gains from exchange that they can obtain. (Corn, Soy) is the only efficient outcome.
- The equilibrium allocation is also fair: both players get the same payoff. In invisible hand games, most people would agree that the best-response equilibrium leads to the most desirable outcome.
The pest control game is an example of a prisoners’ dilemma. The dilemma for the players is as follows:
- There is a dominant-strategy equilibrium (T,T) that is inefficient.
- An alternative outcome, the cooperative outcome (I,I), is efficient, and both players prefer it.
- But if they follow their dominant strategies, they will not achieve the outcome they both prefer.
(I,I) has another potentially desirable property, too: it is fair (payoffs are equal). If participants in an economic interaction could negotiate an agreement beforehand, they could choose strategies that would result in both achieving their second-best outcomes at (I,I) rather than their second-worst outcomes at (T,T).
Notice another aspect of the prisoners’ dilemma: although the cooperative allocation is efficient, the benefits one player receives from not cooperating exceed what they would receive by cooperating. This outcome is at the heart of the game’s “dilemma,” and both players must overcome their self-interest to cooperate and achieve a fair and efficient outcome.
Exercise 6.5 Efficiency and cooperation in the Irrigation game
Refer to the game between Arkady and Barbara in Exercise 6.3.
- Which of the outcomes is efficient? Explain. If you find it helpful, use a figure similar to Figure 6.8 to support your explanation.
Exercise Figure 6.5
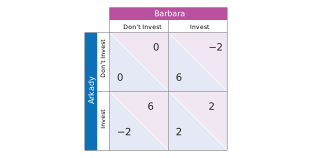
- Contrast the interaction between Arkady and Barbara in Exercise 6.3 with a new interaction between the two of them: Their dairy cattle and potatoes all need irrigated land. As owners of neighboring farms, they are deciding whether to invest in a joint irrigation project. Investing in the project costs 8 units. If only one invests, that person bears the full costs of investment. If both invest, they share the cost equally (4 each). The irrigation provides benefits of 6 units to both parties. Exercise Figure 6.5 captures these payoffs.
- Explain how the payoffs above are calculated. Show that they are consistent with the description by recalculating each payoff.
- Use best-response analysis (the circle-and-dot method) to find the best-response equilibrium of the game.
- Plot the four outcomes of the irrigation game in payoff space (Arkady’s payoff on the horizontal axis, Barbara’s on the vertical axis), as in Figure 6.8. Using your plot, is the outcome at the best-response equilibrium efficient or inefficient? Explain by identifying any outcome that makes both players better off.
- Is this game more like the dairy–potatoes game between Arkady and Barbara in Exercise 6.3 or more like the pest control game in this chapter? Explain.
- Evaluate the fairness of each of the four outcomes by comparing how the gains are divided between Arkady and Barbara. Because some payoffs are negative, do not use percentage shares; instead compare the difference between the two players’ payoffs at each outcome, and note whether either player bears a net cost. Then state whether there is a tension between efficiency and fairness here, and how this compares with the dairy–potatoes game in Exercise 6.3, where the single efficient outcome was also the fairest. [Hint: With negative numbers, a “share of the pie” can be misleading. Compare fairness by (a) the gap between the two payoffs and (b) whether anyone ends up worse than the do-nothing outcome of 0.]
Question 6.6
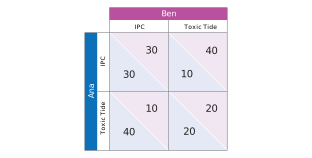
Recall the pest control game between Ana and Ben from Section 6.5, in which each chooses integrated pest control (I) or Toxic Tide (T). The payoffs (Ana’s payoff first) are: (I,I) = (30,30); (T,T) = (20,20); (T,I) = (40,10); (I,T) = (10,40). The payoff table is shown below. The best-response equilibrium is (T,T). Which of the following statements is correct?
Author query: please provide alt-text for the figure below.
Question Figure 6.6
- At (T,T) each player earns 20, but at (I,I) each earns 30. Moving from (T,T) to (I,I) makes both players better off and harms no one, so (T,T) is inefficient. (See Section 6.5, which describes that an outcome is inefficient when there is an alternative in which at least one person is better off and no one is worse off.)
- Equal payoffs describe fairness, not efficiency. (T,T) is fair—both get 20, half of the pie—but it is inefficient because (I,I) makes both better off. Efficiency and fairness are separate criteria.
- Unequal payoffs make (T,I) arguably unfair, not inefficient. In fact (T,I) is efficient: from (40,10) there is no other outcome that makes one player better off without making the other worse off. Do not confuse fairness with efficiency.
- From (I,I) = (30,30), a single player who switched to Toxic Tide would move the outcome to (T,I) or (I,T), earning 40 but reducing the other player to 10—harming the other player. So (I,I) is efficient: no one can be made better off without harming someone.

