Chapter 11 The firm and its workers: Effort and wages
Dacre F. Boulton, Industrial, ca. 1934, oil on canvas, 20 x 301⁄8 in. (50.8 x 76.5 cm), Smithsonian American Art Museum, Transfer from the US Department of Labor, 1964.1.68.
11.1 Introduction: Workers work hard during recessions
Due to a global financial crisis and housing market collapse, the United States experienced a severe recession, often called the “Great Recession”, from December 2007 to June 2009.
The unemployment rate during this period increased from 5% to 9.5%. The total number of unemployed workers rose from 7.6 million to 14.7 million. People who lost their jobs were unemployed longer than unemployed workers before the Great Recession. In January 2008, the average unemployed worker had been unemployed for 17.5 weeks, but by January 2010, the average period of unemployment had risen to 30.3 weeks, and ultimately reached a high of 40.7 weeks. In addition to losing their income, unemployed people paid physical, psychological, and social costs due to the stress, shame, loss of purpose, and isolation of being unemployed.
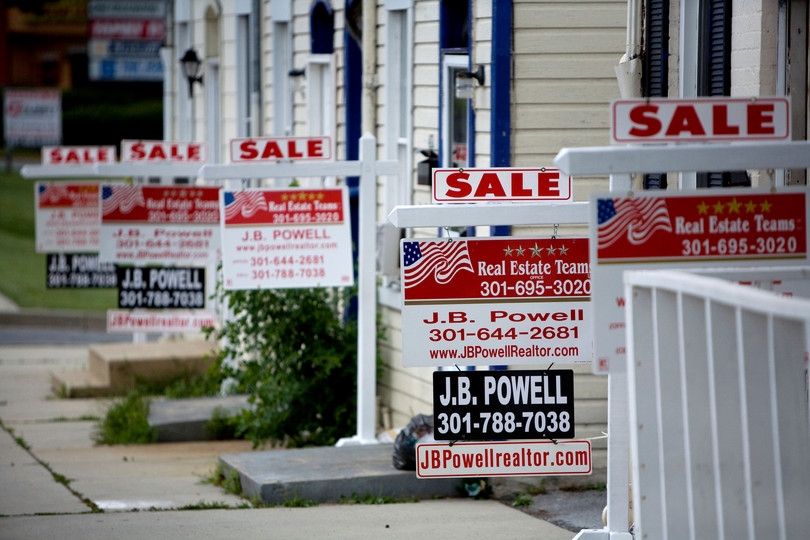
A row of homes for sale in Maryland in July 2008. Millions of homes were lost to foreclosure during the Great Recession.
Less discussed is how recessions affect workers who remain employed. An article from December 2009 in the Los Angeles Times tells the story of one such worker:
When her Irvine [California] office began laying off workers in a lousy economy, Deborah Haas did what every employee fearful of being the next one booted is doing these days: She got busy.
An executive assistant to the head of a furniture company, she became the receptionist, event planner, marketing assistant and office manager. When the catering budget got whacked, she threw on an apron and started whipping up chile lime crab cocktails and carne asada skewers for sales events. … Haas said she’s exhausted when she gets home at night and has less energy for her son, Morgan, 2.
Her situation is a case study of what happens to the workforce during a recession, said Nelson Lichtenstein, an economist and director of the Center for the Study of Work, Labor and Democracy at UC Santa Barbara.
“There’s the phenomenon of people literally working harder, because they’re fearful of losing their jobs,” he said. “Rumors of layoffs are flying, so everyone works really hard.”
Deborah works harder in two costly ways: longer hours and more intense effort. More intense effort requires more physical and psychological exertion. Longer hours also have a physical and psychological cost, as well as an opportunity cost in missed quality time with her family.
In Chapter 10, we looked at how firms and workers find matches. In this chapter, we look at how firms and workers interact once they have established an employment relationship. To understand why workers work harder during recessions and periods of high unemployment, we need to understand how employers get their workers to stay at the job and work hard. The model we build in this chapter also helps us understand why some jobs pay more than others and what other factors might affect how hard a worker works.
Data Extension 11.1 When do people quit their job?
- quit rate
- The quit rate is the number of quits—people voluntarily leaving their job—during the entire month as a percent of the total level of employment.
Deborah would not be alone in her reluctance to quit. Economists use the quit rate to measure the percentage of workers who are quitting their job. The quit rate is the number of times workers voluntarily quit a job during a month divided by the total number of employed workers that month. For example, suppose that during June, 1.5 million workers quit and 150 million workers are employed. In this case, the quit rate is 1%. Figure E11.1 shows the quit rate in the United States between January 2001 and December 2024. The shaded areas indicate periods when the economy was in a recession.

Figure E11.1 Quit rate for United States, 2001–2024.
US Bureau of Labor Statistics via FRED.
Figure E11.1 helps us see that broad economic changes affect the likelihood of workers quitting their jobs. During the recession of 2007–2009, workers were more scared than usual of losing their jobs and hesitated to quit a job if they had one: the quit rate nearly halved! But from 2013 until the COVID-19 pandemic in 2020, a period when the unemployment rate was slowly declining, the quit rate steadily rose. You can also see that the quit rate rapidly increased and then decreased in the four years following the pandemic, highlighting the pandemic’s effects on the labor market.
Exercise E11.1 Exploring the quit rate with FRED
Figure E11.1 comes from Federal Reserve Economic Data (FRED), a comprehensive, up-to-date data source maintained by the Federal Reserve Bank of St. Louis, which is part of the US central banking system. It contains the main aggregate economic statistics for almost all high-income countries going back to the 1960s. FRED also allows you to create your own graphs and export data to a spreadsheet.
We can use FRED to recreate Figure E11.1 and examine the most recent data on the quit rate. To do so, follow these steps:
- Visit the FRED website.
- In the search bar, type “quit rate.” Select the data series labeled “Quits: Total Nonfarm.”
You can also watch this short tutorial to understand how FRED works.
Use the graph you created to answer these questions:
- What is the quit rate for the most recent available data?
- How has the quit rate changed, if at all, over the past year? What might explain any changes you see?
- The shaded areas on the graph indicate periods of recession, or negative economic growth. What typically happens to the quit rate during these periods? What might explain any pattern you see?
- Read the results of this 2021 Pew survey of workers. What are some of the main reasons why the quit rate increased so much in 2021 and 2022? How did the pandemic contribute to these reasons?
Question E11.1
Based on Figure E11.1, what happened to the quit rate during the Great Recession of December 2008 - June 2009? Choose all that apply.
- The quit rate fell sharply, by nearly half.
- The quit rate decreased because workers were less confident.
- Fear of losing jobs made workers reluctant to quit.
- The quit rate showed a clear decline, not stability.
Exercise 11.1 Exploring labor market trends with FRED
Federal Reserve Economic Data (FRED) is a comprehensive, up-to-date data source maintained by the Federal Reserve Bank of St. Louis, which is part of the US central banking system. It contains the main aggregate economic statistics for almost all high-income countries going back to the 1960s. FRED also allows you to create your own graphs and export data to a spreadsheet.
We can use FRED to examine the most recent data on how long the average unemployed worker has been unemployed. To do so, follow these steps:
- Visit the FRED website.
- In the search bar, type “average weeks unemployed.” Select the data series labeled “Average Weeks Unemployed.”
You can also watch this short tutorial to understand how FRED works.
Use the graph you created to answer these questions:
- What time period does the graph cover? What is measured on the vertical axis?
- What is the average weeks unemployed for the most recent available month? How does it compare to other dates in the dataset?
- How has the average weeks unemployed changed, if at all, over the past year? What might explain any changes you see?
- The shaded areas on the graph indicate periods of recession, or negative economic growth. What typically happens to the average weeks unemployed during these periods? What might explain any pattern you see?
Question 11.1
Why did many employed workers increase their work effort during the Great Recession? Choose all that apply.
- Higher unemployment meant weaker outside options, so job loss became more costly.
- Fear of job loss was a major motivator.
- Firms did not typically raise wages; effort rose mainly due to insecurity.
- Rumors and uncertainty created added pressure to work harder.
