5.8 Lessons from the model and how inequality persists over time
Using the ultimatum game, we have modeled a simple two-person interaction to introduce how institutional arrangements, or the rules of the game, affect the distribution of income, mirroring our earlier discussion in Chapters 1 and 2.
We also explored the importance of institutions, policies, endowments, and technology in determining incomes and economic inequality across countries, across groups of people, and across generations. Here we tie those ideas to how inequality persists over time and think about lessons from the model.
How endowments, technology, institutions, and inequality interact over time
Endowments and the income they generate constantly change as people acquire more skills or as the value of an endowment—such as a piece of land or a rental apartment—rises or decreases.
Figure 5.9 illustrates how institutions, policies, technology, and endowments in a given period cause economic inequality. The figure partitions time into “the past,” “the present,” and “the future,” with this discussion focusing on the dynamics of the present. Technology (shaded in cyan blue at the top) and institutions and policies (shaded in cyan blue at the bottom) affect each other because the rules and laws we adopt affect whether we can use certain technologies. Think back to the Bunker Hill Co. in Chapters 1 and 2. Bunker used a smelting technology and was constrained by laws that required them to filter out the pollutants. Similarly, technology may affect the laws we adopt or the norms that people adhere to. For example, the development of smartphones has affected social norms and regulations around privacy. Each of these factors—technology on the one hand, and institutions and policies on the other—also affects people’s endowments (in dark blue): their income, wealth, education, and so on. Finally, each of these factors influences present-day economic inequality (in red). A person’s endowments have a significant effect on where they end up in the income distribution. So do the technologies to which they have access, and the institutions and policies adopted in the country, state, or city where they live. Economic inequality is the final result of the other three factors that cause it.
Everyday Economics 5.12
Think back to Chapter 2 (Section 2.2 and Section 2.3), where we said that people can find ways to change the rules of the game, as the community did when they elected the worker as the mayor of their town. People’s participation in the democratic process demonstrates how processes that perpetuate inequality can be interrupted. What other changes to institutions, policies, or technologies can change people’s endowments? How would those changes affect inequality?
Figure 5.9 shows both how economic inequality can persist over time and how it can be interrupted. For example, changing current institutions and policies can affect present-day and future endowments and thereby lower economic inequality. Adopting a policy to improve education (which affects people’s endowments) such that they earn higher incomes can lower inequality in endowments in the future and thereby lower future economic inequality.
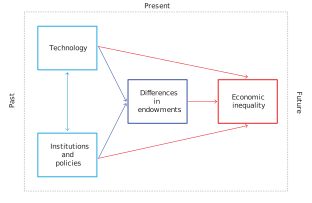
Figure 5.9 Economic inequality in the present is affected by technology, institutions and policies, and differences in endowments. Economic inequality in the present affects the technology, institutions and policies, and differences in endowments in the future.
On the negative side, the children of richer parents may receive more and higher-quality education or greater inherited wealth (differences in endowments). And economic inequality may influence institutions and policies: even in democracies a wealthy person typically has more influence on the government than a poor person does. A greater gap between the rich and the poor could increase the political advantage of the wealthy, resulting in policies favoring those with higher incomes.
Reflecting on the data and the model
Though we have seen in this chapter that inequality across countries varies substantially, it is important for us to consider inequality worldwide given two facts: first, the dramatic decrease in poverty across the world as shown in Figure 3.7 and, second, the decrease in inequality across countries at the same time that inequality increased within countries (as we saw in the skyscrapers in Figure 3.8). These changes were due largely to the rapid increases in average income in two large and historically poor countries, China and India.
The worldwide Gini coefficient for household income based on data from 2019 is 0.62. This represents a significant and sustained decline from 0.70 in 1990, driven primarily by rapid income growth in China, India, and other populous emerging economies.
What does a Gini coefficient of 0.62 mean in terms of how unequal people are? To understand the scale of the differences, consider the following thought experiment. If you were to randomly pick pairs of households from all over the world and compare their income—you might get one family from Indonesia and one from Norway, or one from Brazil and one from India, or two from China—you would find that the richer of the two families, on average, would have approximately 4.3 times the income of the poorer. The super rich are included in this calculation, but they are very few.
Do you think that the income earner (or earners) in the richer of the two families is on average 4.3 times stronger, smarter, more hard-working, or more creative? Clearly, the economy produces inequalities, even among people who may not be very different. It rewards some people with large incomes, and others with barely enough to survive. This is where our attitudes toward fairness, the policies we vote for, and the institutions that we support come in.
Many people consider these income differences—seen as rewards for hard work, risk-taking, or creativity—to be entirely fair, or at least necessary to provide incentives for a well-working economy. But many people regard other income differences—such as the effects of discrimination, coercion, or accidents of birth such as one’s nationality—as unfair. Economics can help to address the problem of unfair inequality by clarifying the causes of economic inequality and contributing to the design of policies that can ensure more just outcomes.
Chapters 6, 7, and 8 build on the tools we have developed here and take them further. In Chapter 6, we consider games like those we started with in Chapters 1 and 2, and we apply the fairness and efficiency framework to them to understand their outcomes. In Chapter 7, we draw on our initial exploration of social preferences in the ultimatum game from this chapter and see how they can help us understand how people behave in a variety of economic interactions. In Chapters 8 and 9, we explore in greater depth what people’s preferences mean and how people achieve their goals while limited by the constraints of time, budget, and hourly wages.
Exercise 5.12 Strikes and the ultimatum game
A strike over pay or working conditions may be considered an example of an ultimatum game. A strike is an interaction between workers (as a collective) and the employer. Workers decide to strike (to stop working) because of wages or working conditions. Employers have to decide what to offer to workers in order to end the strike.
- To model a strike as an ultimatum game, who is the Proposer and who is the Responder? State the assumptions you make when assigning the Proposer and Responder roles.
- (Optional) Draw a game tree to represent the situation between these two parties. (Only answer this question if you completed Extension 5.5a.)
- Research a well-known strike or a recent strike in a country of your choice and explain how it satisfies the definition of an ultimatum game.
- In Section 5.6, you saw experimental data on how people play the ultimatum game. How could you use this information to suggest what kind of situations might lead to a strike?
Exercise 5.13 Institutions and income distribution
- In your own words, define what institutions are. Give one example of a formal institution and one example of an informal institution that can affect income distribution.
- A minimum wage law requires employers to pay workers at least a specified hourly rate. Describe how you think a minimum wage law may affect the income distribution. In your answer, explain what happens to the incomes of the lowest-paid workers and how this affects the Gini coefficient for market income.
- Using Figure 5.9, explain how the minimum wage increase from part (b) could affect people’s endowments and economic inequality in the future. Identify the specific arrows or pathways in Figure 5.9 that your explanation follows.
Question 5.13
Which of the following describes an institution? Choose all that apply.
- Institutions are sets of laws and informal rules that regulate how people interact.
- Institutions do not ensure equal payoffs, but they do create the rules that shape interactions and outcomes.
- The chapter describes institutions as the rules of the game—the laws and norms that determine how people interact as employers and workers, buyers and sellers, and citizens. This includes both formal laws (such as the Civil Rights Act) and informal norms (such as caste marriage restrictions).
- Institutions are not limited to legal systems; they include both formal laws and informal norms.
- Institutions influence behavior and outcomes in various systems, shaping how resources and benefits are distributed.
Question 5.14
Which of the following statements about power in economic interactions are correct? Choose all that apply.
- This is the definition of power.
- Structural power comes from fallback options.
- Bargaining power is about shaping outcomes, not necessarily fairness.
- Setting the terms of the offer shows bargaining power.
Question 5.15
Which one of the following factors is most directly related to an individual’s income?
- Personal preferences may influence decisions, but they are not a primary determinant of income, as discussed in Section 5.2.
- Initial endowments, including skills, education, and assets, play a crucial role in determining an individual’s income.
- The total wealth of the economy affects overall income levels, but it is not a direct individual factor.
- Job availability is important, but not as important as initial endowments.
Concepts to Learn
| Principle | Example from this chapter | Everyday Economics |
|---|---|---|
| Interdependence principle | In the ultimatum game, each player’s outcome depends on what the other does: the Proposer’s payoff depends on whether the Responder accepts or rejects, and the Responder’s willingness to accept depends on how much the Proposer offers. As Figure 5.7 shows, 98% of Kenyan farmers rejected offers of 10% of the pie—meaning a Proposer who ignores the Responder’s social preferences ends up with nothing. At the national level, Figure 5.1 shows that the income shares of the top 1% depend on the institutional and policy choices made by governments and citizens together. | Think about a negotiation or deal you have been part of, such as splitting costs with a friend, dividing up the work in a group project, or asking for something from a parent or employer. How did your outcome depend on what the other person decided? Did you think about how they would react before you made your move? |
| Doing the best you can principle | A self-interested Responder in the ultimatum game will accept any positive offer, so the Proposer doing the best they can should offer as little as possible. But because many Responders have social preferences and reject low offers (Figure 5.7), the Proposer doing the best they can must factor in the Responder’s likely reaction. The Kenyan farmers rejected nearly half of 30% offers, so a Proposer who offered only 30% was not doing the best they could. | Think about a time you had to make an offer or proposal to someone, maybe splitting a restaurant bill, proposing how to divide housework, or asking for a raise. Did you try to figure out the minimum the other person would accept? What does this tell you about what it means to “do the best you can” when other people’s reactions matter? |
| Trade-offs and opportunity costs principle | Responders with social preferences in the ultimatum game face a stark trade-off: accepting a low offer brings real money but means tolerating what they consider an unfair outcome; rejecting means getting nothing but enforcing a fairness norm. As Figure 5.7 shows, Kenyan farmers were willing to walk away from positive offers, paying a real opportunity cost for fairness. At the societal level, Section 5.7 shows that governments face trade-offs between efficiency and fairness when designing redistributive policies; more redistribution may reduce inequality but alter incentives. | Have you ever turned down something valuable—money, a deal, a compromise—because it felt unfair, even when accepting would have left you materially better off? What was the opportunity cost of rejecting it? Can you think of a policy trade-off where society has to give up some efficiency to achieve greater fairness, or vice versa? What would you choose, and why? |
| Principle of mutual gains and conflicts from exchange | In the ultimatum game, both Proposer and Responder can gain from any accepted offer—their outside option is zero. But the division of the $100 pie is a source of conflict: the Proposer wants to keep as much as possible, while the Responder’s sense of fairness limits how little they will accept. Figure 5.1 illustrates the same dynamic at the national level: economies grow through cooperation among workers, firms, and governments, but the share going to the top 1% versus everyone else varies dramatically across countries and over time. | Think about a situation where you and someone else both benefited from cooperating—a team project, a shared living arrangement, a work partnership—but there was tension over how the gains or responsibilities were divided. Who had more bargaining power? How was the conflict resolved? Was the outcome fair? |
| Principle of individual and societal interests | Individuals doing the best they can—using social networks to find jobs, investing heavily in their own children’s education, or maximizing personal wealth—collectively sustain high levels of inequality at the societal level. Figure 5.5 shows that in the United States, only 7.5% of children born to the poorest 20% of fathers make it to the richest 20% as adults, compared with 11–12% in Denmark and Australia. Figure 5.9 illustrates how individual-level decisions about endowments, reinforced by institutions and policies, feed back into future inequality. | Think about how you found out about an opportunity, such as a job or an internship. Did your family background, social network, or neighborhood give you an advantage that others might not have had? If many people gain access to opportunities primarily through personal connections, what does that mean for equality of opportunity in society? Do you think people have a responsibility to think about these broader effects, or is it the role of institutions and policies to address them? |
| Rules of the game principle | The rules of the ultimatum game—who is the Proposer, what offers are allowed, whether the Responder can refuse—determine who has bargaining power and how the $100 pie gets divided (Section 5.5). Extensions 5.5a and 5.5b show that changing the rules (such as adding competition among Responders) changes outcomes. At the national level, Figure 5.4 demonstrates that fiscal policy rules—how much governments tax and redistribute—transform market income inequality (Gini of 0.52 in both the US and Finland) into very different levels of disposable income inequality (0.38 in the US versus 0.27 in Finland). | Think about a rule at school, at work, or in a game you play regularly that determines who gets a bigger share of the rewards. What would happen if that rule changed? Can you think of a tax, transfer, or labor market policy that you think is particularly fair or unfair? Who benefits from the current rules? Who would benefit if the rules changed? |
Seeing the Principles in Action
- Market income and disposable income
- Gini coefficient and rich/poor ratio as measures of income inequality
- Fiscal policy and redistribution
- Categorical inequality and accidents of birth
- Intergenerational inequality
- Endowments, institutions, policies, and technology as drivers of inequality over time
- Preferences: self-interested preferences and social preferences (fairness, altruism, reciprocity, self-determination)
- Using experiments to understand people’s behavior and preferences
- Economic man (Homo economicus)
- Ultimatum game
- Economic rent in the context of bargaining
- Strategic asymmetry, structural power, and bargaining power
- Allocation
- Efficiency (Pareto efficiency)
- Fairness: substantive and procedural
- Equality of opportunity
Skill and learning objectives
- Reading and interpreting an empirical graph (and its terms)
- Defining important economic terms
- Understanding the design of an experiment and how to interpret its outcomes
- Reading comprehension (difficult material)
- Seeing how institutions change game outcomes
- Applying the individual and societal interests principle
- Applying the interdependence and opportunity cost and trade-offs principles
References
Almås, Ingvild, Alexander W. Cappelen, and Bertil Tungodden. 2020. “Cutthroat Capitalism versus Cuddly Socialism: Are Americans More Meritocratic and Efficiency-Seeking than Scandinavians?” Journal of Political Economy 128(5): pp. 1753–1788.
Alvaredo, Facundo, Anthony B. Atkinson, Thomas Piketty, Emmanuel Saez, and Gabriel Zucman. 2016. The World Wealth and Income Database (WID).
Beatson, Robert. 1804. Naval and Military Memoirs of Great Britain, from 1727 to 1783 (vol. 3). Longman, Hurst, Rees and Orme.
Bowles, Samuel, and Herbert Gintis. 2002. “The Inheritance of Inequality”. Journal of Economic Perspectives 16(3): pp. 3–30.
Chen, Wen-Hao, Michael Förster, and Ana Llena-Nozal. 2013. “Globalisation, Technological Progress, and Changes in Regulations and Institutions: Which Impact on the Rise of Earnings Inequality in OECD countries?” Working Paper Series 597. LIS.
Corak, Miles. 2013. “Inequality From Generation to Generation: The United States in Comparison”. In The Economics of Inequality, Poverty, and Discrimination in the 21st Century, edited by Robert S. Rycroft. Santa Barbara, CA: Greenwood Pub Group.
Fischbacher, Urs, Christina M. Fong, and Ernst Fehr. 2009. “Fairness, Errors, and the Power of Competition”. Journal of Economic Behavior and Organization 72(1): pp. 527–545.
Hamermesh, Daniel S., and Anwen Zhang. 2024. “The Economic Impact of Heritable Physical Traits: Hot Parents, Rich Kid”. NBER Working Paper No. 32086, January.
Henrich, Joseph, Richard McElreath, Abigail Barr, Jean Ensminger, Clark Barrett, Alexander Bolyanatz, Juan Camilo Cárdenas, Michael Gurven, Edwins Gwako, Natalie Henrich, Carolyn Lesorogol, Frank Marlowe, David Tracer, and John Ziker. 2006. “Costly Punishment Across Human Societies”. Science 312(5781): pp. 1767–1770.
Jäntti, Markus, Bernt Bratsberg, Knut Røed, Oddbjørn Raaum, Robin Naylor, Eva Österbacka, Anders Björklund, and Tor Eriksson. 2006. “American Exceptionalism in a New Light: A Comparison of Intergenerational Earnings Mobility in the Nordic Countries, the United Kingdom, and the United States”. Discussion Paper Series 1938. Institute for the Study of Labor.
Leeson, Peter T. 2007. “An-arrgh-chy: The Law and Economics of Pirate Organizations”. Journal of Political Economy 115(6): pp. 1049–1094.
Leeson, Peter T. 2009. “The Invisible Hook: The Law and Economics of Pirate Tolerance”. New York University Journal of Law and Liberty 4(2): pp. 139–171.
Persico, Nicola, Andrew Postlewaite, and Dan Silverman. 2004. “The Effect of Adolescent Experience on Labor Market Outcomes: The Case of Height”. Journal of Political Economy 112(5): pp. 1019–1053.
Stantcheva, Stefanie. 2021. “Understanding Tax Policy: How Do People Reason?” The Quarterly Journal of Economics 136(4): pp. 2309–2369.
Stantcheva, Stefanie. 2024. “Perceptions and Preferences for Redistribution”. Oxford Open Economics 3 (Supplement 1): pp. i96–i100.
Vivekinan, Ashok, Ilyana Kuziemko, and Ebonya Washington. 2015. “Support for Redistribution in an Age of Rising Inequality: New Stylized Facts and Some Tentative Explanations”. Brookings Papers on Economic Activity, pp. 367–405.

