Chapter 5 The distribution of income: Endowments, technology, institutions, and policy
Suffragists on their way to Boston.
5.1 The Great Recession and the incomes of the 1%
In the early-morning hours of September 15, 2008, Lehman Brothers, an investment bank, filed for bankruptcy after 164 years in business.
In March 2023, fifteen years after the failure of Lehman Brothers, there was a run on the Silicon Valley Bank in California. Other regional banks in the United States were also near collapse, as was the 167-year-old Credit Suisse Bank in Zurich, which failed and was purchased by another bank.
- asset
- Something that is owned and has value.
Lehman’s owners had reaped extraordinary profits from the housing boom of the early 2000s, but a sharp decrease in house prices beginning in 2007 had generated substantial losses for the bank’s assets. The bank went into regular insolvency proceedings: the legal process people or organizations go through when they cannot pay their debts.
- mortgage
- A loan contracted by households and businesses to purchase a property without paying the total value at one time. Over a period of many years, the borrower repays the loan, plus interest. The debt is secured by the property itself, referred to as collateral.
- default
- A borrower who fails to repay a loan, or repays less than is required under the contract, is said to default on the loan. More generally, default is any failure to meet the terms of a contract.
- foreclosure
- When a borrower defaults on their mortgage payments, meaning that they fail to maintain the regular payments required for their mortgage, a bank seizes the lender’s asset (the home) to sell the asset to cover the outstanding loan amount. This seizure is called foreclosure.
- recession
- The US National Bureau of Economic Research defines a recession as a period when output is declining. It is over once the economy begins to grow again.
Lehman Brothers was one of the banks that supplied mortgages. But, during the housing crisis, many people who got those mortgages stopped making their mortgage payments, defaulted on their mortgages, and lost their homes to foreclosure. With people failing to make payments on their mortgages, banks failing, and insurance companies going bankrupt, the economy went into a recession that lasted until late 2009, the so-called “Great Recession.”
At the time, Walt McMurray, an electronics technician from Loxahatchee, Florida, said, “You don’t know where things are going to end up … I just keep worrying that someone will show up at the door to kick us out of our home and change the locks.”
After losing his job in 2008, Mr. McMurray fell behind on the mortgage payments for the house he bought in 1994. In 2010, he still owed $243,000 on his mortgage, but he had made his last mortgage payment 18 months earlier, in 2008.
- inequality
- Inequality refers to the degree to which income, wealth, or other economic resources are distributed unevenly among people or groups in a society. It can be measured using statistical tools such as income percentiles, the Gini coefficient, or income shares held by different segments of the population (for example, the top 10% vs. the bottom 10%, called the Rich/Poor ratio).
- unfair
- An outcome or process is unfair if it violates a person’s or society’s conception of justice. See also fairness.
Many people, including Mr. McMurray, lost their homes during the recession. At the same time, the government “bailed out” the banks (that is, rescued them by providing them with cash to cover their debts and losses). Bankers, who had profited from risky lending, often kept their positions and incomes, but ordinary people bore the costs in foreclosures and unemployment. Many people, including Mr. McMurray, saw the bailouts of banks as a stark example of inequality. People viewed the unequal outcomes and the unequal treatment by policymakers as unfair: a violation of their conception of justice. What do economists say about inequality, and how can economics help us understand questions of fairness?
The incomes of the top 1%
Economists Facundo Alvaredo, Anthony Atkinson, Thomas Piketty, Emmanuel Saez, and Gabriel Zucman published research showing how the incomes of the top 1% have changed over time. In collaboration with other researchers, they generated the data graphed in Figure 5.1, which displays the income shares of the top 1% of income earners across various countries.
Author query: The manuscript requests for links to the interactive graphs from the TE1.0 Figures 19.3 and 19.4 to be included here. Please indicate which text you would like linked, or where you would like those links to be added (such as in the source for the figure, or elsewhere?)
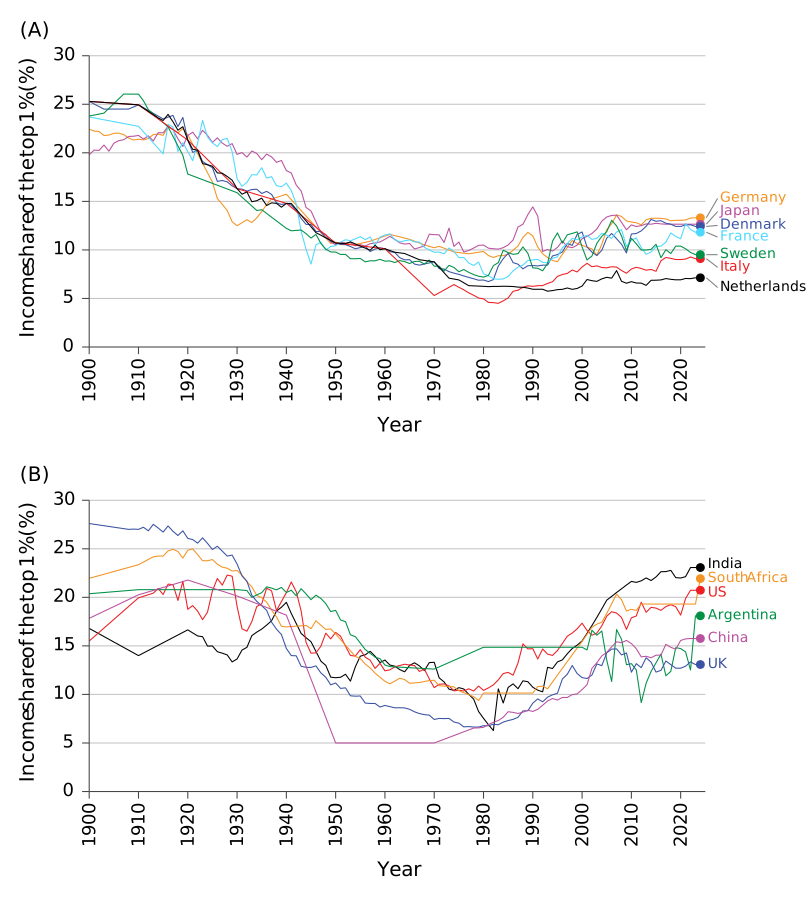
Figure 5.1
The share of total income received by the top 1%, 1900–2024. The top panel shows the countries in which the rise was modest and the lower panel shows the countries in which the rise was more significant.
The figures show the market income (prior to taxes and government transfers) of the richest 1% as a fraction of total market income. By this measure, inequality in market income fell in every country over most of the twentieth century, and then after 1980 rose substantially in some countries (panel (B)) and modestly in others (the European nations and Japan, shown in panel (A)).
Facundo Alvaredo, Anthony B. Atkinson, Thomas Piketty, Emmanuel Saez, and Gabriel Zucman. 2016. The World Wealth and Income Database (WID). World Inequality Database (WID.world) (2026)
The axes of the income shares of the top 1%
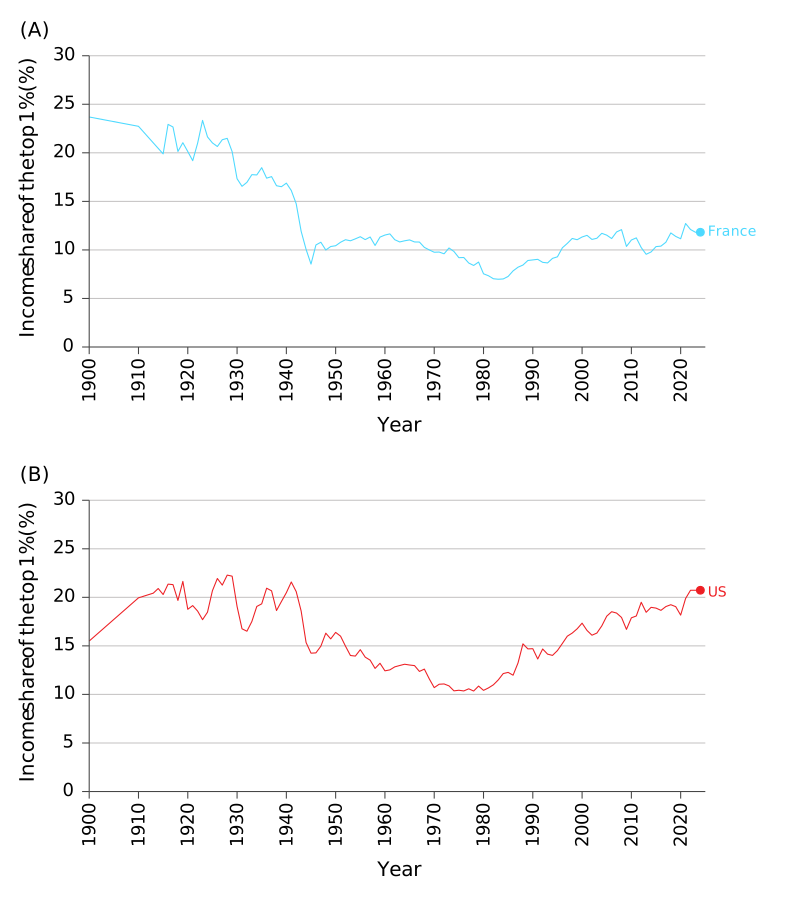
The axes of the income shares of the top 1% in France (panel A) and the United States (panel B)
The axes of the income shares of the top 1% in a sample of European countries and Japan (panel A) and a sample of other countries internationally (panel B)
Figure 5.1(A) shows, for example, that in 1905, the top 1% in Sweden earned approximately 25% of the country’s income. In the following decades this share decreased such that by 2010 the top 1% had about 11% of the country’s income. After 2010, the share rose slightly in Denmark and the Netherlands. Figure 5.1(B) shows countries with a large increase in inequality after 1980, such as the United States, the United Kingdom, and China.
Institutions, endowments, policies, and technology
In this chapter, we examine how to measure inequality and strive to understand its causes. To understand those causes, we return to a figure we saw in Chapter 1, Figure 1.1, shown here as Figure 5.2.
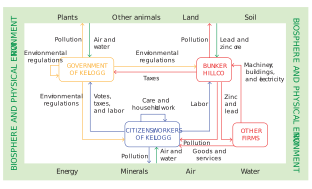
Figure 5.2 The economy of Kellogg, Idaho as originally shown in Figure 1.1. The figure shows the institutions, endowments, and policies of the town as well as, implicitly, its technologies.
Author note: We are aware of the incorrect font size in this sidenote’s bulleted list. We will resolve this shortly.
- endowment
- A person’s endowments are the things they have that enable them to receive income. They include physical wealth (for example: land, housing, machinery); financial wealth (for example: savings, stocks/shares, bonds); intellectual property (for example: patents, copyrights); knowledge, skills, abilities, and experience that affect labor income; citizenship and rights to work. They can include characteristics such as nationality, gender, race, and social class, if these affect their income.
- human capital
- The stock of knowledge, skills, behavioral attributes, and personal characteristics that determine the labor productivity or labor earnings of an individual. Investment in human capital through education, training, and socialization can increase the stock. Human capital is part of an individual’s endowment. See also endowment.
Endowments can be things people own, have, or are, including:
- Financial wealth, including their savings and/or the stocks or bonds that they own, on which they receive interest or dividends.
- The physical assets they own, such as land, buildings, and machinery that generate profits or rental payments.
- Intellectual property, such as copyrights or patents that affect whether they can (or cannot) reap the profits resulting from new ideas.
- Knowledge, skills, and other personal attributes affecting their value to an employer and hence their labor earnings (sometimes called their human capital).
- Their race, gender, age, and other aspects of themselves that may affect their employment, their wages, and/or other exchanges.
- Their citizenship and whether they have a visa, which determine whether they can legally work in a particular country and therefore their labor earnings.
- institutions
- An institution is a set of laws and informal rules that regulate social interactions among people, and between people and the biosphere; sometimes also termed “the rules of the game.”
- policy
- A government action designed to address a specific issue or achieve a particular goal. At the federal level in the US, policies typically take the form of laws passed by Congress (the legislative branch), executive orders issued by the president (the executive branch), or rules and regulations established by government agencies (such as the Federal Reserve).
- endowment
- A person’s endowments are the things they have that enable them to receive income. They include physical wealth (for example: land, housing, machinery); financial wealth (for example: savings, stocks/shares, bonds); intellectual property (for example: patents, copyrights); knowledge, skills, abilities, and experience that affect labor income; citizenship and rights to work. They can include characteristics such as nationality, gender, race, and social class, if these affect their income.
- technology
- A process that uses a set of materials and other inputs, including the work of people and machines, to produce an output.
The economy of Kellogg has all of the ingredients that are at the core of our model of what causes inequality:
- Institutions: The institutions are shown by the capitalist firms in Kellogg such as the Bunker Hill Co., as well as the rules of the game determining employment of the workers in Kellogg and the democratic rules of the government.
- Policies: The government of Kellogg (as well as those of the state of Idaho and the US) adopted environmental regulations limiting what the Bunker Hill Co. can do and specified the taxes the company and workers in Kellogg have to pay.
- Endowments: The endowments of each citizen of Kellogg and the owners of Bunker include, for the workers, their education, health, work skills, and other factors contributing to their wages, and for the owners, the zinc and lead in the ground being mined, along with the machinery and other capital goods owned by the Bunker Hill Co.
- Technologies: The technologies in Kellogg include what it takes to mine the ore and to filter the lead out by the smelting process, labor with particular skills, and the machinery designed for the task. Technologies also include the medical knowledge and equipment to help the citizens of the town recover from their lead exposure.
Counterparts of each of these factors in Kellogg also play out in entire countries. The differences among the countries in Figure 5.1—as well as their commonalities—can help us explore the reasons inequality arises.
- capital-intensive technology
- A technology that requires a comparatively large amount of capital goods, such as equipment, machinery, and buildings.
- labor-intensive technology
- A technology that requires a comparatively large amount of human labor.
- The countries differ in their institutions—their laws and norms—and how they affect the level of inequality in the society and what people can and are willing to do about it.
- The countries also differ in the policies they adopt, such as their tax policy (how much people at different income levels pay) and the amount they provide to residents as welfare, child support, education, and other public goods.
- Finally, the countries differ in the endowments people have and in the technologies that residents have access to and adopt. People’s endowments include their education, the intellectual property to which they have access, and their material resources and income. A country’s technologies encompass the methods people can use to produce goods and services, as well as the degree to which the production in a given country is capital intensive or labor intensive.
Having started to think through what generates inequality, we now turn to a well-known way of measuring inequality: the Gini coefficient. We show that the Gini coefficient—like the income share of the top 1%—differs significantly across countries.
Exercise 5.1 Comparing the income shares of the top 1% across countries
Access the interactive versions of the data for Figure 5.1, panels (A) and (B), from Our World in Data. Choose two countries to compare with the United States. Use the following steps to describe what happens to the income share of the top 1% of earners during that period in the two countries you chose:
- State what time period the data cover for the countries you have chosen.
- Name one specific observation (time, value of the income share of the top 1%) for each country you have chosen.
- Describe the overall trend over time for each country you have chosen. Did inequality increase or decrease over time in the countries you chose?
- Compare the patterns in the countries you chose to the pattern in the United States. Do the patterns in the countries you chose match panel A or panel B, or are they entirely different?
Question 5.1
What notable pattern occurred in most wealthy countries (shown in Figure 5.1(A)) during the mid-20th century (approximately 1940–1980)?
- There was an initial decrease in inequality in the countries in Panel A, and then the level of inequality remained relatively stable.
- There was a period of relatively low and stable top 1% income shares during this period.
- Although inequality had decreased from the start of the century, it was not “completely eliminated,” as that would have implied that the top 1% of the income distribution would hold 1% of all income.
- There was significant variation in the inequality in emerging economies and in the wealthy European economies in Panel A. We cannot claim that inequality was greater in the European economies in Panel A than in the emerging economies, because in some of the emerging economies, inequality was higher.

