2.2 Profits
You are excited to get your brewery, called CORE Brewing Co., up and running. The timing is perfect because you are also taking an economics course and learning about how firms determine the price to charge and how much to produce in order to maximize their profits.
- profits
- A firm’s profits are the difference between its total revenue and total costs, including opportunity costs.
- opportunity cost
- The opportunity cost is the net benefit of the next-best alternative—what you give up when you make a choice.
We explained in Chapter 10 that a firm’s profits are the difference between its total revenue and total costs, including its opportunity costs of capital. The profits for your brewery are the revenue generated by beer sales minus the costs incurred in production, including the opportunity costs.
To understand profits, we need to know how much it costs to make your beer and the revenue you generate from selling it to buyers.
Total revenue
To guide your decision-making, you can create a simple data table using actual cost estimates for your brewery and price information you believe could work based on your market research to illustrate the revenue generated by producing and selling different quantities of beer.
Suppose the quantity of beer produced, denoted by the letter \(Q\), represents the number of kegs that CORE Brewing Co. produces daily. Each keg holds about 15.5 gallons (70 liters) of beer. Economists often refer to quantity as the firm’s output.
The first column in Table 12.1 displays different levels of output, ranging from \(Q = 0\) to \(Q = 10\text{ kegs per day}\). For simplicity, let’s assume your brewery produces only one beer type. Your beer’s unique taste differentiates it from your competitors’ products.
- total revenue
- A firm’s total revenue is the number of units sold times the price per unit.
Total revenue is the money that CORE Brewing Co. earns from selling its beer to buyers. Total revenue is calculated by multiplying the price per keg by the quantity of kegs sold at that price. Revenue is important for covering costs. It allows you to pay your workers, purchase ingredients, rent space to produce and sell your beer, and cover operational costs such as water and utilities.
Before you calculate your brewery’s revenue, you first need information on the price. The second column in Table 12.1 provides price information, which we denote with the letter \(P\). You might be wondering where the price information comes from. As we explain in more detail later in this chapter, the price information represents what buyers are willing to pay for your craft beer. In this scenario, we can think of the buyers as restaurants and bars that purchase beer by the keg.
Suppose that when you charge buyers $400 per keg, you sell zero kegs of beer because that is the amount of your beer that buyers choose to buy at that price. When you charge buyers $280 per keg, your brewery sells 3 kegs because more buyers are interested in purchasing your beer when it is less expensive. When you charge buyers $160 per keg, you sell 6 kegs because even more buyers want to buy your beer now that the price is lower. The price information in the second column reveals an important pattern: As the price of CORE’s beer decreases, the quantity of beer produced and sold increases. Why?
Imagine setting a very high price for your beer. In this case, only the restaurants and bars that strongly prefer CORE Brewing Co. over other craft brewers are willing to buy it. These are your diehard buyers, and they may not be numerous enough to generate high sales.
Now imagine that you lower the price. As the price decreases, more buyers, who might have otherwise chosen beer from competing craft breweries, become interested in purchasing CORE Brewing Co.’s beer instead. The lower price makes your beer a more attractive option, increasing demand and sales.
Using the price (\(P\)) and quantity (\(Q\)) data, we can calculate the total revenue CORE Brewing Co. generates when producing and selling different quantities of beer. We calculate total revenue, denoted by TR, by multiplying the price of a keg of beer (\(P\)) by the quantity (\(Q\)) of beer sold at that price. For example:
- When your price is $280 per keg, buyers want to purchase 3 kegs of your beer and your total revenue is $280 × 3 = $840.
- When your price is $160 per keg, buyers want to purchase 6 kegs of your beer and your total revenue is $160 × 6 = $960.
The third column in Table 12.1 shows that as CORE Brewing Co. sells more beer, revenue initially increases, but only up to a certain point. Total revenue continues to rise until 5 kegs of beer, after which it begins to decline. Why does revenue grow and then shrink?
To sell 6, 7, or 8 kegs of beer, you must lower the price significantly. Although selling more kegs at a lower price may attract more buyers, each keg generates less revenue. Eventually, the price drops so low that the increase in sales can’t make up for the lost revenue per keg, causing total revenue to shrink.
Everyday Economics 12.4
Do you participate in a rewards program? Ulta, a US beauty retailer for cosmetics, fragrances, and skin and hair care products, has over 40 million buyers using its reward program, which gives buyers one point for every dollar spent and opportunities to earn double or triple points. Ulta’s reward program has been so successful that consumers post dozens of TikTok videos in which they explain how to use the program to maximize points. How might a rewards program impact a firm’s total revenue?
While understanding how revenue changes with different quantities of beer is important, profit is also influenced by costs, which we explore next.
Total costs
Craft brewers face a variety of costs when producing beer, including costs for hiring workers; purchasing hops, malt, and yeast; renting retail or industrial space to brew beer; purchasing brewing equipment; and packaging and shipping. Some costs depend on how much beer you produce. For example, the more beer you brew, the more hops and workers you need. Other costs, such as rent for your brewing space, must be paid, regardless of how much beer you produce.
- opportunity cost
- The opportunity cost is the net benefit of the next-best alternative—what you give up when you make a choice.
- total cost
- A firm’s total costs are the sum of all the costs it incurs to produce its total output, including opportunity costs.
Brewers also encounter opportunity costs in producing craft beer, such as the interest they would have earned on the capital they invest in the brewery or the profits they would have earned by producing T-shirts instead of beer. A firm’s total costs, denoted by TC, are the sum of all the costs it incurs to produce its output, including opportunity costs.
Everyday Economics 12.5
Do you consider your opportunity costs to be real costs that you incur? Or do you see them as “what-ifs” that don’t matter? Suppose you run your own business out of your garage. What else could you be doing with your time, money, and garage if you were not operating your business?
Table 12.2 extends Table 12.1 by adding total costs at different quantities of beer produced. The fourth column illustrates that as CORE Brewing Co. produces more kegs of beer, total production costs increase. More beer requires more workers, ingredients, electricity, water, and other resources, leading to higher costs. In other words, producing more beer incurs greater costs.
Economic profits
- profits
- A firm’s profits are the difference between its total revenue and total costs, including opportunity costs.
Now that we have data on total costs and total revenue, we can determine CORE Brewing Co.’s profits. CORE’s profits are the difference between the total revenue that it receives from selling beer and the total costs of producing it. We show these profits in the last column of Table 12.2.
- If CORE produces and sells 2 kegs, total revenue is $640, total costs are $260, and profits (the difference between total revenue and total costs) are $640 – $260 = $380.
- If CORE produces and sells 4 kegs, total revenue is $960, total costs are $420, and profits are $960 – $420 = $540.
As Table 12.2 shows, the brewery’s profits are positive from 1 keg to 7 kegs of beer because total revenue exceeds total costs. Even though profits are positive at each of these output levels, they grow larger as you produce up to 4 kegs of beer. After that, profits shrink when you produce 5, 6, or 7 kegs. At 8 kegs of beer, your profits turn negative, which means that it costs more to produce your beer than the revenue you earn selling it to buyers, and you are making a loss.
Let’s create a visual map to help us better understand how profits vary across different combinations of price and quantity. In Figure 12.4, we place the price of beer on the vertical axis and the quantity of kegs on the horizontal axis. The different colors in the figure represent different levels of profits at each price-quantity combination. This figure is similar to the heat map we saw in Chapter 8 that illustrated Annika’s preferences for ice cream and burritos. Here, the heat map shows how profits vary instead of preferences.

Figure 12.4 CORE Brewing Co.’s more profitable and less profitable combinations of price and quantity.
CORE Brewing Co. will make the most profits if it can charge a high price and sell many kegs of beer. It will make the least profits if it sells a lot of beer at a low price (because it will not be covering its costs of production). Selling a few kegs at a high price leads to some, but not much, profit. Selling an intermediate number of kegs at neither too high nor too low a price leads to intermediate profits.

Selling a lot of beer at a high price means the firm makes a lot of profit

Selling a lot of beer at a low price means the firm makes a very low profit, or losses

Selling few kegs at a high price leads to some, but not much, profit
Selling some kegs at a medium price makes neither the highest nor the lowest profit
- the principle of doing the best you can
- Doing the best you can means that, from the set of actions available to them, people will choose the action that they believe will result in the outcome that they value the most, taking into account what they believe the other player will do in response to their choice.
Dark-purple areas represent combinations that lead to the lowest profits (losses). If CORE Brewing Co. sells many kegs but at a very low price (for example, less than $40 per keg), its profits are negative because the total revenue earned from selling at such a low price is less than the total costs to produce many kegs of beer. While buyers would love to pay only $40 per keg, Figure 12.4 illustrates that selling at a very low price is not consistent with doing the best you can to earn the highest possible profits.
In contrast, bright-yellow areas show combinations with the highest profits. If CORE can sell many kegs at a high price (for example, more than $400 per keg), profits will be very high. As the owner of this brewery, you might think that doing the best you can means selling a large number of kegs at a high price because that will ensure that you are maximizing your profits. However, this is not the case.
- principle of trade-offs and opportunity cost
- The gains you make by choosing some action typically come at the cost of gains that would have been possible had you acted differently.
Although you might prefer to charge a very high price for your beer and sell a large number of kegs at that price (yellow-shaded area), you need to remember that not all combinations are feasible. As we saw in Table 12.2, not all buyers are willing to pay $400 for a keg of your beer, and producing large quantities of beer adds significant cost. These constraints mean that combinations involving both extremely high prices and large quantities are not realistic options for your brewery. We can see the trade-off and opportunity costs principle come into play. To sell more kegs, you may need to lower your price, giving up higher revenue on those units in exchange for higher production and sales.
- the principle of doing the best you can
- Doing the best you can means that, from the set of actions available to them, people will choose the action that they believe will result in the outcome that they value the most, taking into account what they believe the other player will do in response to their choice.
The doing the best you can principle reminds us that your goal is to choose the best option among the feasible ones. The bright-yellow areas in Figure 12.4 are not feasible. In other words, you want to earn as much profit as possible, but you must make your decisions within the boundaries set by your buyers’ willingness to pay and your production costs. This suggests that doing the best you can might take you somewhere in the middle of Figure 12.4 where you sell some kegs at a medium price and you earn profits somewhere in between the highest and lowest levels.
When we talk about profits, we specifically mean economic profits, which take into account opportunity costs, which were embedded in the TC column in Table 12.2. Economic profits differ from accounting profits, which consider only explicit costs and do not take into account opportunity costs. As a result, accounting profits are always higher than economic profits.
While Table 12.2 shows us where economic profits are highest, it doesn’t explain why profit is maximized at that point or how CORE Brewing can get there. The table shows the outcome, but not the reasoning behind it. To truly understand how firms make decisions, we need to go deeper. In the next few sections, we examine the different types of costs that make up total costs, explore the importance of opportunity costs, and learn how firms use marginal analysis to weigh the additional benefits of producing one more unit against the additional costs. Without this deeper understanding, the table is just a snapshot and not a decision-making tool quite yet.
Data Extension 12.2 Women in craft brew
To learn more about women’s role as the original brewers, read the essay “How Women Brewsters Saved the World” by Tara Nurin.

Figure E12.2 Ownership of US breweries by gender, 2021.
Bart Watson. 2021. New Owner Demographic Benchmarking Data. Brewers Association.
A 2021 survey from the Brewers Association found that only 0.2% of brewers identified as nonbinary.
Listen to J. Michelle Brock describe her co-authored study that found evidence of gender bias in bank lending in Turkey.
Despite their underrepresentation in modern craft brewing, women and non-binary brewers are no different from men brewers who want to produce high-quality beer, earn profits, and support their environmental and social goals. However, women and non-binary brewers may encounter gender-specific barriers in their efforts to earn profit. For example, they may find it challenging to operate their businesses if banks are less likely to give loans to them, more likely to charge them higher interest rates on loans, and/or more likely to require a guarantor (someone who agrees to pay the borrower’s loan when the borrower is unable to pay it) on loans to women or non-binary individuals. Organizations such as Pink Boots Society support women and non-binary individuals in the brewing industry to overcome some of these barriers.
Women owners might also face discrimination and bias from consumers. According to a 2019 study by Elise Tak, Sarah A. Soule, and Shelley Correll titled “Those Who Don’t Know, Discriminate: Gender Inequality in Product Markets”, men have a negative bias against craft beer produced by women. In the study, the authors asked participants to evaluate beer based on a product label that provided fictitious information about the brewer’s gender. For example, the brewer’s name was specified as Sarah or David (Figure E12.3). The label also provided a brief description of the brewer’s career and referred to Sarah with she pronouns and David with he pronouns. The overall evaluation index consisted of participant responses to questions about their likelihood of buying the beer, the amount they were willing to pay for the beer, and their expectations of the beer’s quality and taste.
The researchers found evidence that a woman brewer’s beer is evaluated worse than an identical beer produced by a man. However, if the beer is recognized as having won an award, then beer produced by women is evaluated more favorably. The researchers also found that when participants had greater knowledge of craft beer (they were beer enthusiasts), they did not evaluate beer produced by women more negatively. These results suggest that recognizing the talent of women brewers may reduce some buyers’ bias.
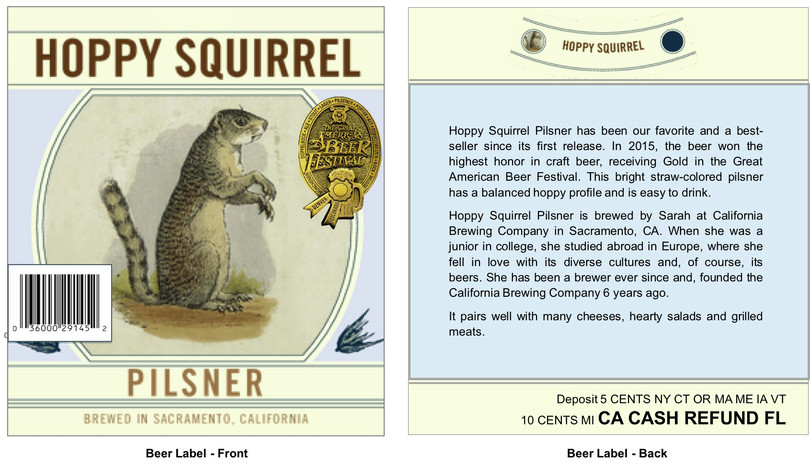
Figure E12.3 Label used in gender bias study.
Aine Doris. 2019. “Better if it’s Man-Made”. Insights by Stanford Business. March.
While all firms try to do the best they can, the study referenced above suggests that women and men face different constraints.
Exercise 12.2
-
Think about a small business in your community, such as a local bakery or boutique. Describe the potential sources of revenue for this business and the types of costs it might incur. How do these revenues and costs compare to those of CORE Brewing Co.?
-
Consider the scenario of Table 12.2. Suppose the rent for CORE Brewing Co. increases by $100, adding to its total costs. Additionally, CORE decides to increase its prices by 20%. Determine the new quantity of beer (in kegs) that generates the highest amount of profit. Is profit higher or lower compared to the original scenario?
Question 12.2
Which of the following statements are true about economic profit? Choose all that apply.
- Economic profit is usually lower than accounting profit because economic profit includes opportunity costs.
- Economic profit accounts for opportunity costs.
- Positive economic profit means a firm is covering all explicit and opportunity costs.
- Negative economic profit means total costs exceed total revenue.
