5.6 An experiment: Self-interest and fairness in the United States and Kenya
An experiment using the ultimatum game was run with a group of farmers in Kenya and a group of US students at Emory University in Atlanta, Georgia.
Proposers could offer 0%, 10%, 20%, 30%, 40%, or 50% of the pie to Responders. The experimenters asked each Responder whether they would Accept or Reject each of the potential offers a Proposer could make.
The Responders’ choices
Check your understanding of the actions of the Responders in each setting by going through the steps in Figure 5.7. The height of each bar indicates the fraction of Responders who were willing to accept the offer indicated on the horizontal axis. For example, offers of 10% of the pie were accepted by 58% of the students, but only 2% of the farmers. Offers of 50% were accepted by all Responders in both countries.
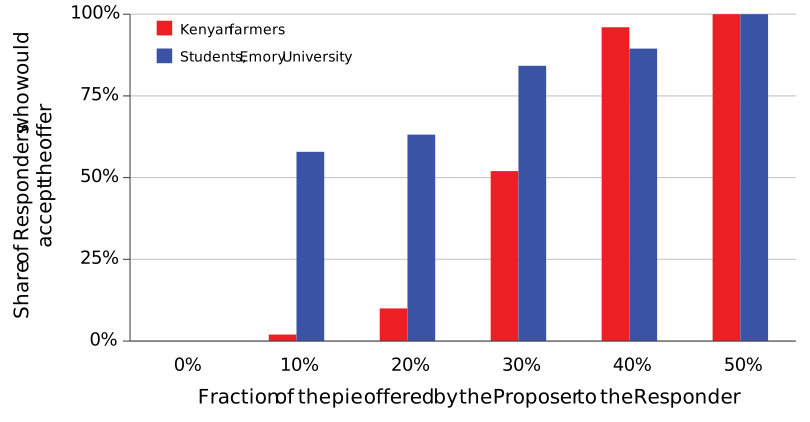
Figure 5.7 Offers accepted by Responders.
Adapted from Joseph Henrich, Richard McElreath, Abigail Barr, Jean Ensminger, Clark Barrett, Alexander Bolyanatz, Juan Camilo Cárdenas, Michael Gurven, Edwins Gwako, Natalie Henrich, Carolyn Lesorogol, Frank Marlowe, David Tracer, and John Ziker. 2006. “Costly Punishment Across Human Societies”. Science 312 (5781): pp. 1767–1770.
Axes for the ultimatum game experiment in Kenya and the United States (Responders)
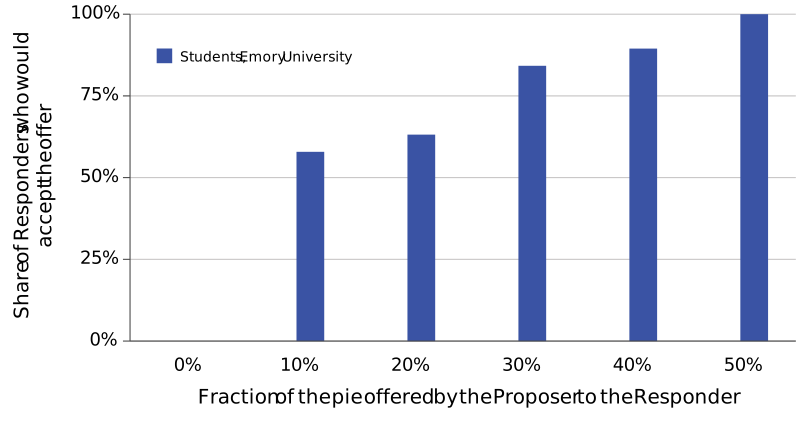
The choices of the US students at Emory University in Atlanta
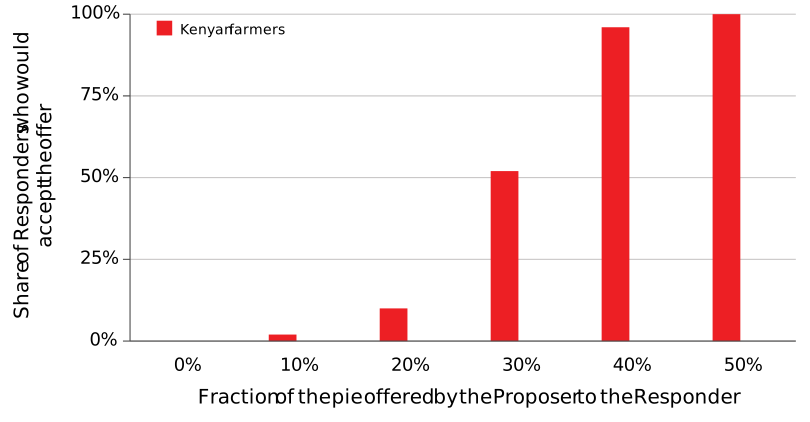
The choices of the Kenyan farmers
The choices of the US students and the Kenyan farmers
A self-interested Responder will accept any offer greater than zero: a positive amount is always better for themselves than rejection. Figure 5.7 suggests that many Responders were not motivated purely by self-interest because many rejected positive offers. No one in either group (farmers or students) accepted an offer of zero; they preferred to ensure that the Proposer got nothing as well. Kenyan farmers were very unlikely to accept low offers, with almost half rejecting offers of 30%. The results suggest that in both groups Responders were influenced by social preferences, though attitudes toward fairness and willingness to lose money to punish unfair behavior differed across the groups.
Extension 5.6 The Proposers’ Offers
Author query: the manuscript lists the title of this extension as “The Proposers’ Offers” but the linked document with the extension has the heading “The Proposers’ behavior”. Please confirm which heading we should use.
Now let’s look at the Proposers’ behavior. The full height of each bar in Figure E5.8 indicates the fraction of the Proposers who made the offer shown on the horizontal axis. Figure E5.8 suggests that the Kenyan farmers made more generous offers. About 50% of them offered 40% or more. Only 11% of the American students made such generous offers.
But were the farmers really being generous? Their offers depend on what they expect the Responders to do. From Figure 5.7, we know that 89% of farmers accepted an offer of 40% of the pie, but lower offers were much less likely to be accepted. If this is what the Proposer-farmers expected, then making a low offer was risky. Even if they didn’t care about the other person at all, they may have decided to offer 40% if they worried that a lower offer would be rejected.
Figure E5.8 also shows in darker shading the proportion of each offer that was rejected (from the data in Figure 5.7). Proposers could use their knowledge of their own community’s preferences and norms to estimate the likelihood of Responders rejecting different offers. If they did this successfully, then their expectations would be similar to actual rejection decisions. Proceed through the steps in Figure E5.8 to make sure you understand the Proposers’ actions and expectations.
Author note: We are aware of the missing Figure E5.8 and are working to resolve it.

Figure E5.8 Offers made by Proposers, showing the proportion that Proposers could expect to be rejected.
Adapted from Joseph Henrich, Richard McElreath, Abigail Barr, Jean Ensminger, Clark Barrett, Alexander Bolyanatz, Juan Camilo Cárdenas, Michael Gurven, Edwins Gwako, Natalie Henrich, Carolyn Lesorogol, Frank Marlowe, David Tracer, and John Ziker. 2006. “Costly Punishment Across Human Societies”. Science 312(5781): pp. 1767–1770.

Axes for the ultimatum game experiment in Kenya and the United States (Proposer).

The offers made by U.S. Proposers.

The offers made by Kenyan Proposers.

The offers made by Proposers to the Responder.
Fraction of Proposer offers and the proportion of offers expected to be rejected.
Look at the Kenyan farmers’ offers.
- Very few offered 0% (4% of them, as shown in the far left-hand red bar), and all of those offers would have been rejected (the entire red bar is shaded).
- 10% offered half the pie (red bar), which ensured an acceptance rate of 100% (the entire bar is light).
- Offers of 30% were almost as likely to be rejected as accepted (the shaded and unshaded parts of the bar are almost the same size).
Exercise E5.4 What do Proposers in the ultimatum game do?
Refer to Figure E5.8. As Proposers, how often did Emory students offer 40% or more of the pie, and how does this compare with Kenyan farmers?
Data Extension 5.6 The effect of competition in the ultimatum game
Ultimatum game experiments with two players provide insight into how people may choose to share rent in economic interactions. But the outcome of a negotiation may be different if it is affected by competition. For example, a professor looking for a research assistant could consider several applicants rather than just one.
Consider an ultimatum game in which a Proposer offers a two-way split of $100 to two respondents rather than one. These are the rules:
- If only one Responder accepts, that Responder and the Proposer get the split, and the other Responder gets nothing.
- If no one accepts, the three players get nothing.
- If both Responders accept, one is chosen at random to receive the split.
If you were one of the Responders, what is the minimum offer you would accept? Is your choice affected by the fact that there are two Responders rather than one? Perhaps it depends on whether you think your competitor wants the reward very much or is strongly motivated by fairness.
Figure E5.9 shows some laboratory evidence for a large group of participants playing multiple rounds of this game. Proposers and Responders were randomly and anonymously matched in each round. The red bars show the fraction of Responders who rejected offers in the game with one Responder, and the blue bars show the fraction of all Responders who rejected offers in the game with two Responders competing. In almost all cases, individual Responders were less likely to reject offers when they were competing with another Responder.
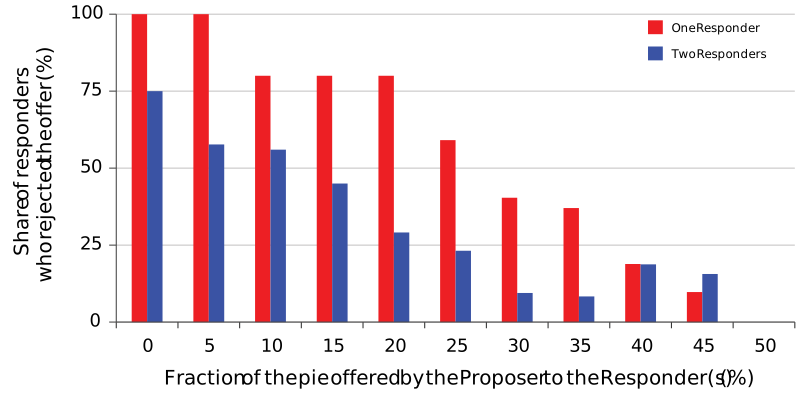
Figure E5.9 Proportion of Responders who rejected offers in the ultimatum game, according to offer size and the number of Responders.
Adapted from Figure 6 in Urs Fischbacher, Christina M. Fong, and Ernst Fehr. 2009. “Fairness, Errors, and the Power of Competition.” Journal of Economic Behavior and Organization 72(1): pp. 527–45.
The Responders’ behavior when there is competition seems more similar to what we would expect of self-interested individuals concerned mostly about their own monetary payoffs.
To understand this phenomenon, think about what happens when a Responder rejects a low offer. The Responder gets a zero payoff, but the Proposer may still get a positive payoff if the other Responder accepts. Rejecting no longer has the same impact on the Proposer. Rejection is therefore a less useful instrument for punishing a Proposer who is not following a social norm of fairness. This is particularly the case if Responders have different preferences or states of need: a Responder who cares about fairness cannot rely on the other Responder to reject low offers.
Consequently, even people with preferences for fairness will accept low offers to avoid the worst of both worlds. Of course, Proposers also know this, so they will make lower offers. And their position is further strengthened because they need only one of the Responders to accept. In this experiment, the average accepted offer was 43% of the pie in the one-Responder game, but only 26% of the pie in a two-Responder game. A change in the rules of the game can make a big difference to the outcome.
Lessons from the ultimatum game: Preferences, power, and institutions
The ultimatum game teaches us lessons that apply to many economic interactions, whether social (sharing the gains from a community or group project) or private (determining the price of a secondhand car).
Tying together preferences, power, and institutions
The results of the experiments suggest that many people have social preferences and that others anticipate those social preferences. The participants in the two groups differed, with Kenyan farmers rejecting lower offers and making more generous offers than US students. These cross-cultural differences tell us something important: What counts as “fair” is shaped by social norms and context, which vary across societies; offers considered fair in the US were not considered generous enough to be fair in Kenya. In neither country did most people behave like “economic man.”
- economic rent
- Economic rent is the difference between the net benefit (monetary or otherwise) that an individual receives from a chosen action, and the net benefit from the next-best alternative (or reservation option).
By rejecting low offers, Responders are willingly sacrificing their own economic rent—real money above their outside option of nothing—in order to punish the Proposer for an offer that violates their sense of fairness. They were literally paying for fairness. “Economic man” would never do this: for someone with purely self-interested preferences, any positive offer is better than zero, and accepting—even if you are getting just one penny—means you’re doing the best you can. The experimental results show that, in practice, many people treat economic rent as something to be shared fairly.
Everyday Economics 5.8
The way people behave in experiments can predict how they react in real-life situations. For example, fishermen in Brazil who acted more cooperatively in an experimental game also fished more sustainably than less cooperative ones. Think about the ultimatum game and how you would behave in the experiment. Write down the choices you would make if you were the Proposer and also your choices if you were the Responder. Do your choices correspond to your behaviors in the real world? If yes, how so?
- strategic asymmetry
- Strategic asymmetry exists when one side of a strategic interaction has more power to make offers, set the rules of the game, or move first in the interaction. Because of this advantage, they can shape the outcome in their favor.
- rules of the game principle
- The rules of the game affect how the players play the game, the size of the gains from cooperation available to the players, and how the gains are divided among the players.
- power
- The ability to do and get the things we want in opposition to the intentions of others.
The ultimatum game is an example of a game, like those in Chapter 1 and Chapter 2, with strategic asymmetry: One side of the interaction (like Bunker or the Proposer) has more power to make offers, set the rules of the game, or move first. Consequently, they can shape the outcome of the game to their advantage such that they get a larger share of the gains from cooperation or more economic rent.
The results from the ultimatum game tell us something about how people respond to rules of the game as well as the importance of power in bargaining relationships. We learned these lessons in Chapter 1 and Chapter 2 when discussing how changes in institutions—such as the Fair Labor Standards Act—were themselves the result of negotiation between the Worker and Bunker to change both the distribution of power and the outcomes that each received. The Fair Labor Standards Act shows us that people are willing to engage in costly collective action—strikes, worker slowdowns, potential job loss—to try to improve their outcome. The ultimatum game shows us how important fairness is for people like the Worker who might reject what they consider an unfair offer.
The role of power
- power
- The ability to do and get the things we want in opposition to the intentions of others.
- structural power
- The extent of a person or firm’s advantage in a bargain that is determined by the relative value of their next-best alternative to the bargain.
- bargaining power
- The extent of a person or firm’s advantage in securing a larger share of the economic rents made possible by an interaction.
In Chapter 1 we defined power as the ability to do and get the things we want in opposition to the intentions of others: the Bunker Hill Company had more power than the workers of Kellogg did. Here we build on that definition and differentiate two different kinds of power: structural power and bargaining power.
- Structural power: When we consider conflicts over how something of value will be divided, the amount of a person’s structural power is the value of their next-best alternative. Having structural power means being able to walk away from a bad deal. We call this a form of power because when two people voluntarily engage in buying or selling something, or one employs the other, the deal they strike must give each of them an outcome that is an improvement over what they could get if they ended the relationship and took their next-best alternative. Your structural power is the least you could get in some economic interaction.
- Bargaining power: The structural power of two parties to a voluntary interaction determines both the most and the least that a person can get if an interaction takes place. What each person gets between these two extremes is determined by their bargaining power. A person exercising bargaining power may:
- set the terms of an exchange, for example, by making a take-it-or-leave-it offer (as in the ultimatum game)
- impose or threaten to impose heavy costs unless the other party acts in a way that benefits the person with power.
| Example | ||
|---|---|---|
| Type of power | Worker and Bunker interaction | Everyday economics |
| Structural power | In Figure 1.5, we saw that the bargains that the Worker and the Bunker Hill company could come to were constrained by each player’s outside option—that is, their structural power limited what each could get from the other. In Figure 2.2 in Chapter 2, we saw that changing the Worker’s quality of life somewhere else (not in Kellogg) improves the worst of the bargains that Bunker can get the worker to accept. The Worker’s structural power had improved. | Consider your own structural power. When you go for a job interview, is it better or worse if you already have a job offer in hand as a next-best alternative? Why? How would already having another job offer affect your ability to negotiate wages or benefits? Explain. |
| Bargaining power | In Figure 1.5 in Chapter 1 Bunker is the only employer in town, and it received a much larger share of the rents and had significantly greater bargaining power than the Worker did. In contrast, in Figure 2.4 in Chapter 2, which depicts the outcome after the workers had organized and elected the Worker as mayor of Kellogg, Bunker shared the gains from cooperation (economic rents) equally with the Worker. This suggests that the Worker and Bunker have relatively equal bargaining power. | If you’re buying a car, it helps to know the lowest price the seller will accept. If you know they will make money selling the car at any price over $20,000 you would be in a position to make a take-it-or-leave-it offer similar to being a Proposer in the ultimatum game. For example, you might offer $20,500. In this way, knowledge about minimum values that a seller is willing to accept is a form of bargaining power. That is why we use resources like Kelley Blue Book, Edmund’s, or other online price guides when bargaining over used car prices with a private seller or dealership. |
Table 5.1 Examples of structural and bargaining power.
- rules of the game principle
- The rules of the game affect how the players play the game, the size of the gains from cooperation available to the players, and how the gains are divided among the players.
Table 5.1 compares different examples of structural and bargaining power using the interaction between the Worker and Bunker in Chapter 1 and Chapter 2, and in specific Everyday Economics examples. In each, we can identify the importance of the next-best alternatives (structural power) and how much one party can offer the other party (bargaining power) as determined by the rules of the game. We highlight in the examples how Bunker and the Worker exercised or were affected by either structural power or bargaining power. For example, the initial payoffs that the Worker could receive from Bunker were affected by the options of jobs they could get elsewhere (see Figure 1.5). When those options improved (see Figure 2.2), the Worker could demand more from Bunker because of a change in structural power.
The role of institutions
Experiments demonstrate that the rules of the game affect
- how the game is likely to be played
- the size of the total payoff available to the participants
- how this total is divided.
In the ultimatum game, the rules specify the size of the pie, who gets to be the Proposer, what the Proposer can do (offer any fraction of the pie), what the Responder can do (Accept or Reject), and who gets what as a result. The rules affect the payoffs that the players will get—the extent of their advantage when dividing the pie. The power to make a take-it-or-leave-it offer gives the Proposer more bargaining power than the Responder, and it usually results in the Proposer getting more than half of the pie. The Proposer can get at least half the pie because 50-50 offers are almost always accepted. Still, the Proposer’s bargaining power is limited because the Responder has the power to refuse.
Everyday Economics 5.9
In the labor market, the power to set the terms of the exchange typically lies with those who own the business: they are the ones proposing the wage and other terms of employment. Workers seeking employment are like Responders, and because usually more than one qualified person is applying for the same job, the Responders’ bargaining power will be low. A worker holding out for a higher wage than the employer has offered will be passed over. Whether a person is an employer or a worker depends on who has the financial resources to own a company that employs people. Chapter 10 and Chapter 11 explore these dynamics in greater detail. What kinds of jobs have you, a family member, or a friend had? Have you, a family member, or a friend been an employer? How did being on either side affect the offers you were willing to make or to accept?
In our examples, the institutions provided:
- constraints
- A limit placed on an actor that determines the combination of goods, outcomes, or actions that a decision-maker can choose.
- incentives
- An economic reward or punishment, which influences the benefits of alternative courses of action.
- the constraints, such as the maximum offer of $50 that the Proposers could make in the experiment with the Kenyan farmers and American students, and
- the incentives, the total rents available to each player, such as the $100 the Proposer has to split with the Responder.
Because institutions determine who can do what, and how payoffs are distributed, they determine the power people have to get what they want. In experiments, the assignment of the Proposer or Responder role, and hence the assignment of bargaining power, usually occurs by chance. In real economies, though, the assignment of power is not random and has significant implications for the final outcome in any interaction and how the economic rents are shared. Changing the rules of the game changes the outcome, as Extensions 5.5a and 5.5b showed.
Exercise 5.8 Social preferences in the ultimatum game between farmers, family, and friends
Consider the results of the ultimatum game experiment, as shown in Figure 5.7 and Extension 5.6.
- Which of the preferences that you studied in Section 5.5 can help to explain the behavior of Proposers in this experiment? Refer to Extension 5.6 for information on the Proposers’ actions.
- How do you think the Proposer and Responder would behave if you played the ultimatum game with two different sets of players—your classmates and your family? Explain whether or not you expect the results to differ across these groups. If possible, play the game separately with your classmates and your family and comment on whether the results are consistent with your predictions.
Exercise 5.9 Comparing offers made by Kenyan farmers and Emory students
- Refer to Figure 5.7 and Extension 5.6. What do the Responders’ acceptance rates suggest about the importance of fairness to Emory students?
- How likely were Emory students to expect their low offers to be rejected compared to Kenyan farmers?
- Overall, what do your answers suggest about Emory students’ social norms and expectations regarding fairness in the ultimatum game?
Question 5.9
Based on the results shown in Figure 5.7, which of the following statements are correct? Choose all that apply.
- Kenyan farmers were more likely to reject low offers.
- Although Emory students accepted low offers more often, this does not mean they had purely self-interested preferences.
- Both groups rejected all offers of 0%.
- Very few Kenyan farmers accepted a 20% offer; acceptance was much lower than half.
Question 5.10
Consider an ultimatum game where the Proposer offers a proportion of $100 to the Responder, who can either accept or reject the offer. If the Responder accepts, both the Proposer and the Responder keep the agreed share. If the Responder rejects, then both receive nothing. Figure 5.7 shows the results of a study that compares the responses of US university students and Kenyan farmers.
From this information, which conclusions can we draw? Choose all that apply.
- The Kenyan farmers in the experiment were more likely to reject low offers than the US students. This does not imply that all Kenyans are more likely to reject low offers than all Americans.
- “The Proposer keeping 30%” means the Responder receives 70% of the pie, a very generous offer that nearly all Responders in both groups would accept. The chapter reports that approximately half of Kenyan farmers rejected offers of 30% to the Responder (that is, the Proposer keeps 70%). This answer confuses which party receives 30%, making its numerical claim incorrect.
- In both groups of Responders, 100% rejected the offer of receiving nothing.
- The fact that Kenyan farmers were more likely to reject unfair offers and thus forgo any income suggests that they value fairness more.

